Tech Frontier · Wed, Apr 15, 2026
When an Airport Runway "Speaks"
Miao YU
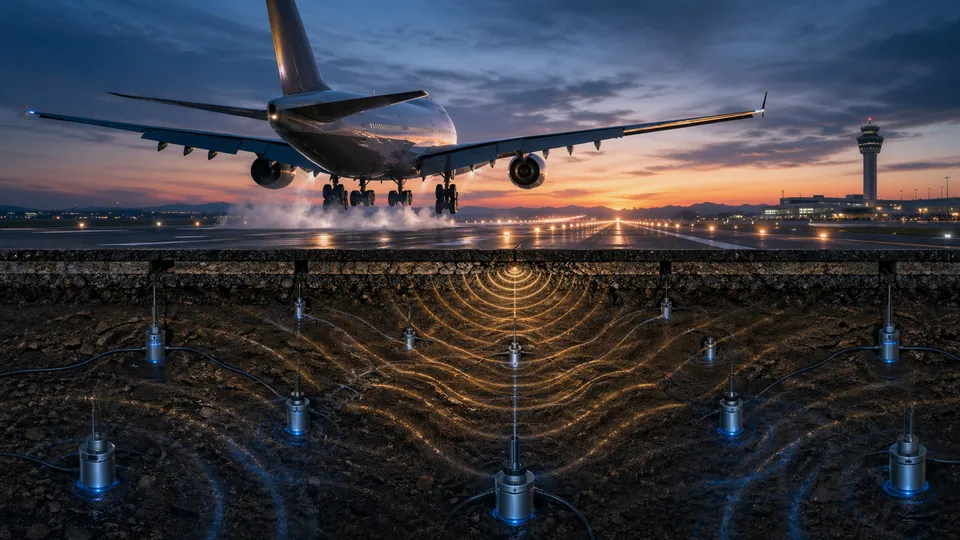
A wide-body aircraft touches down at roughly 270 kilometers per hour. At the moment of contact, hundreds of tonnes of metal, fuel, and passengers transfer their kinetic energy into the runway surface in a fraction of a second. The runway flexes — imperceptibly to the human eye, but measurably. The ground beneath it moves.
That movement is information. Not just “something happened here” — but the aircraft’s ground speed at touchdown, its deceleration profile through braking, its liftoff point, the mechanical load it imposed on the runway structure at that precise location, and whether anything anomalous occurred during the rollout. All of it encoded in vibration, waiting to be read.
Not the kind of information captured by cameras watching the tarmac, or by radar tracking the aircraft’s approach path, or by load cells embedded in the runway surface at selected points. A different kind: a continuous, full-frequency record of exactly how the runway and the ground beneath it responded to that particular aircraft, at that particular speed, with that particular landing technique, on that particular day.
If you know how to read it, a runway can tell you quite a lot.
The Problem with Watching from Above
Before explaining what seismic sensing can do, it is worth being precise about what existing technologies cannot.
Radar is the backbone of aircraft tracking, and it works well at altitude. Near the ground, radar suffers from terrain interference and electromagnetic clutter — and at runway level, where aircraft are accelerating or decelerating through a narrow corridor a few meters above concrete, its limitations become significant. Visual systems — cameras, lidar, optical sensors — are excellent in daylight and clear weather. In fog, rain, or darkness, their performance degrades. And neither radar nor cameras can see below the surface: a void forming beneath a runway slab, progressive concrete fatigue, or internal joint deterioration are invisible to any optical or electromagnetic system.
Acoustic sensing has also been explored. But in outdoor airport environments, the signal-to-noise ratio of airborne sound is substantially lower than that of ground vibration — aircraft are loud, but their acoustic signatures compete with wind, engine ground run-ups, vehicle traffic, and the general ambient noise of a busy aerodrome.
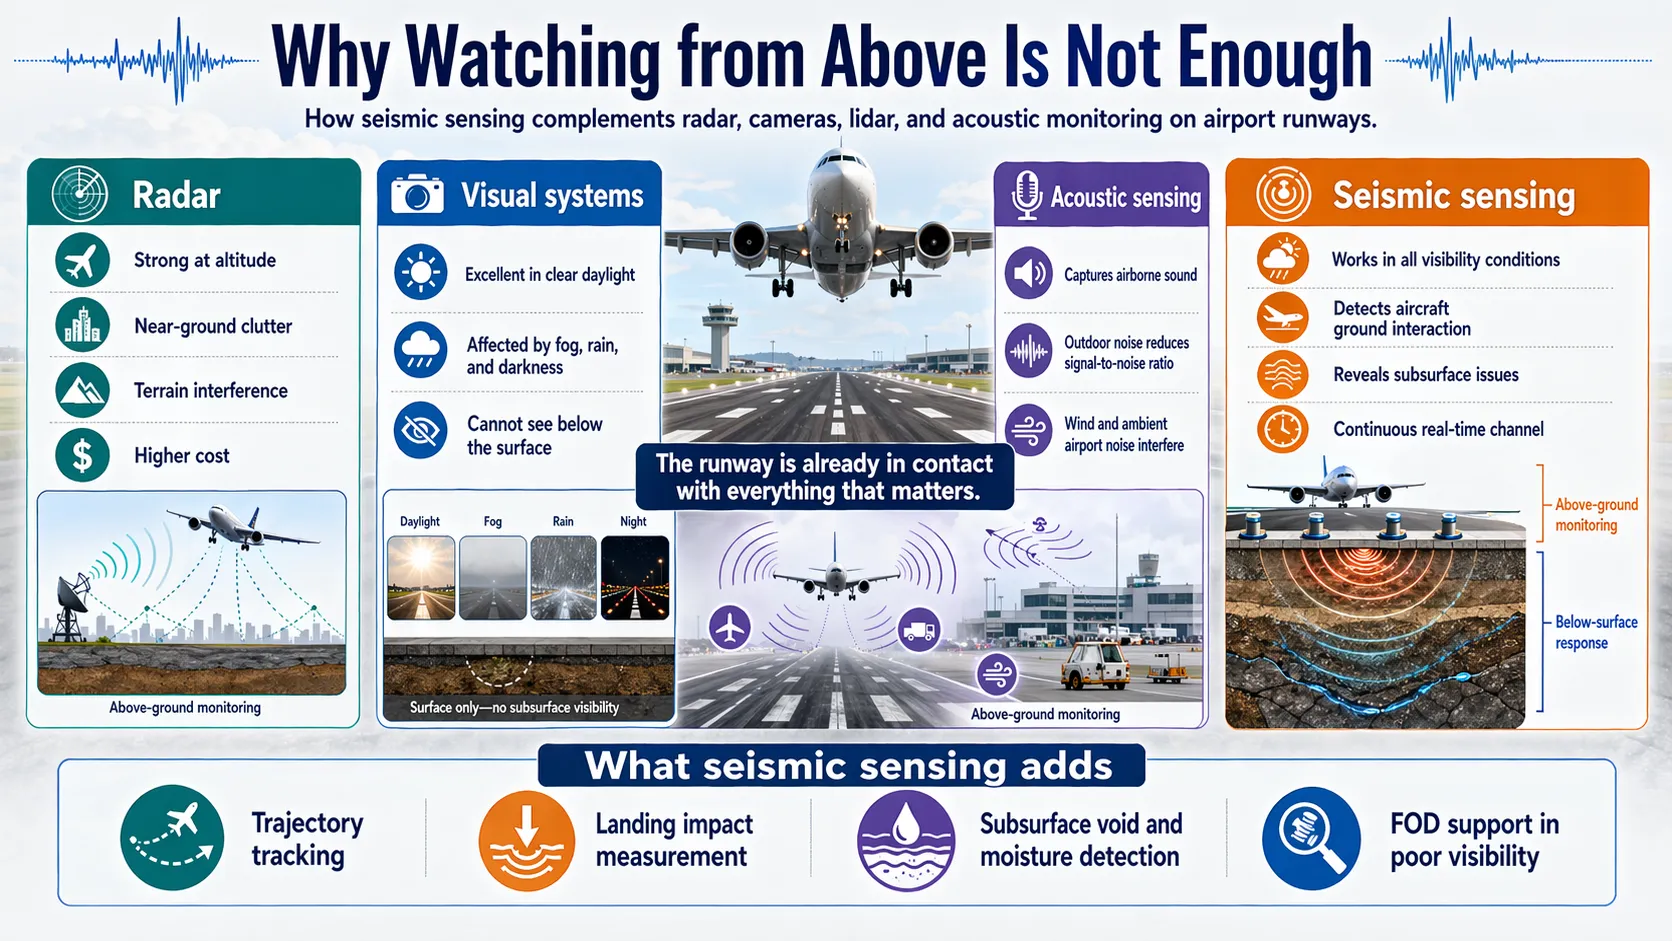
Ground vibration is different. The runway is already in contact with everything that matters. Every aircraft that touches it, rolls along it, or flies low enough above it leaves a measurable seismic trace. The channel is always open — in fog, in rain, at 3 a.m., and for events happening two meters below the surface that no camera will ever see.
Four Frequency Bands, Four Stories
When an aircraft lands, it generates vibrations across a wide frequency range — and different frequency bands carry fundamentally different information. Separating these bands is not just a signal processing step; it is the key to making sense of what the runway is saying.
Below 1 Hz — the structural band. At these very low frequencies, the signal reflects the large-scale mechanical response of the runway to load: the flex of the concrete slab, the response of the substrate beneath it. This is also the band where ground-rolling aircraft leave their cleanest trajectory signature. When processed with a 0.1–1 Hz bandpass filter, an aircraft’s path along a runway appears as a smooth, unambiguous trace — the seismic equivalent of a clean track on fresh snow.
1–10 Hz — the contact band. This is where things get complicated, and interesting. Main gear makes contact with the runway first, followed by nose gear touchdown — two mechanically distinct events, each with its own characteristic impulse. Thrust reversers deploy. Wheel brakes engage. Each of these generates its own characteristic vibration signature in this frequency range, producing a superposition of overlapping signals that together describe the full mechanical sequence of a landing in considerable detail.
10–50 Hz — the airborne band. At these frequencies, the aircraft’s engines and aerodynamic surfaces couple acoustically with the ground even before the aircraft physically touches it. Once airborne again after landing, the high-frequency signal persists and dominates. This band effectively tracks the boundary between ground contact and flight: the transition is sharp and unambiguous in the 10–50 Hz record.
100–150 Hz — the acoustic coupling band. This is the most surprising frequency range. After landing, as thrust reversers deploy, a distinct class of waves appears in this band. Analysis of the propagation speed — approximately 341 m/s — identifies them as airborne acoustic waves: the sound of the engine thrust reversers coupling into the ground. An aircraft landing generates, in effect, a brief but powerful atmospheric acoustic source, and the ground records it.
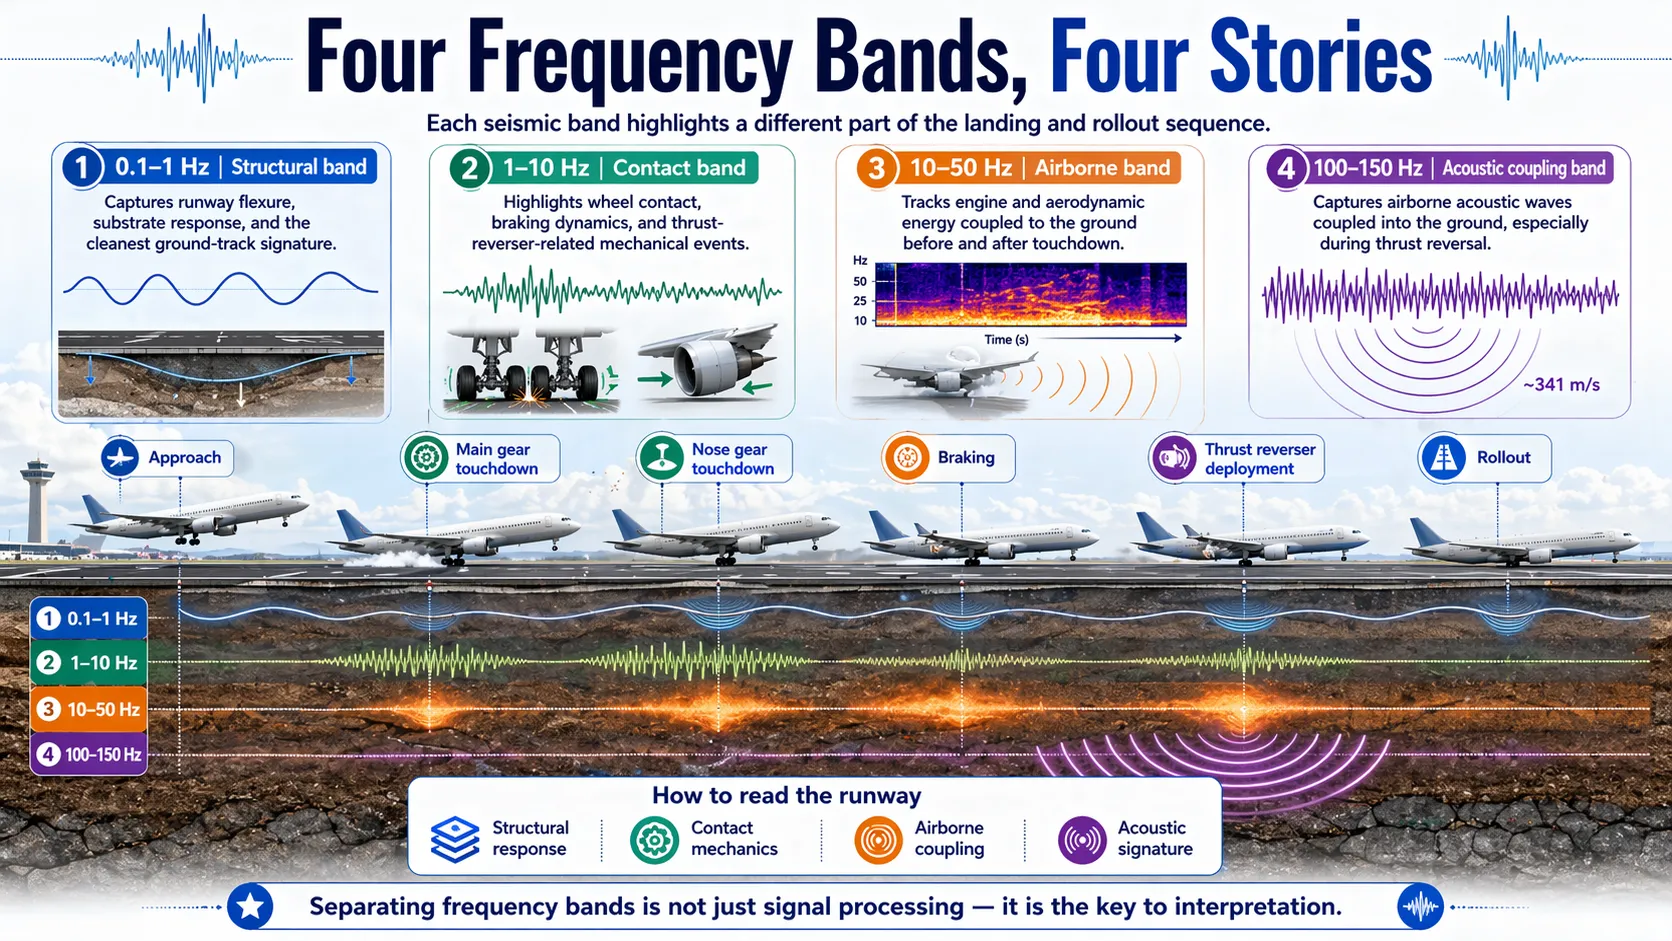
Each band, filtered appropriately, tells a different part of the story. Together, they constitute a multi-dimensional description of every landing event, resolved in time and space across the full length of the runway.
121 Sensors, 1000 Hz, 792 Gigabytes
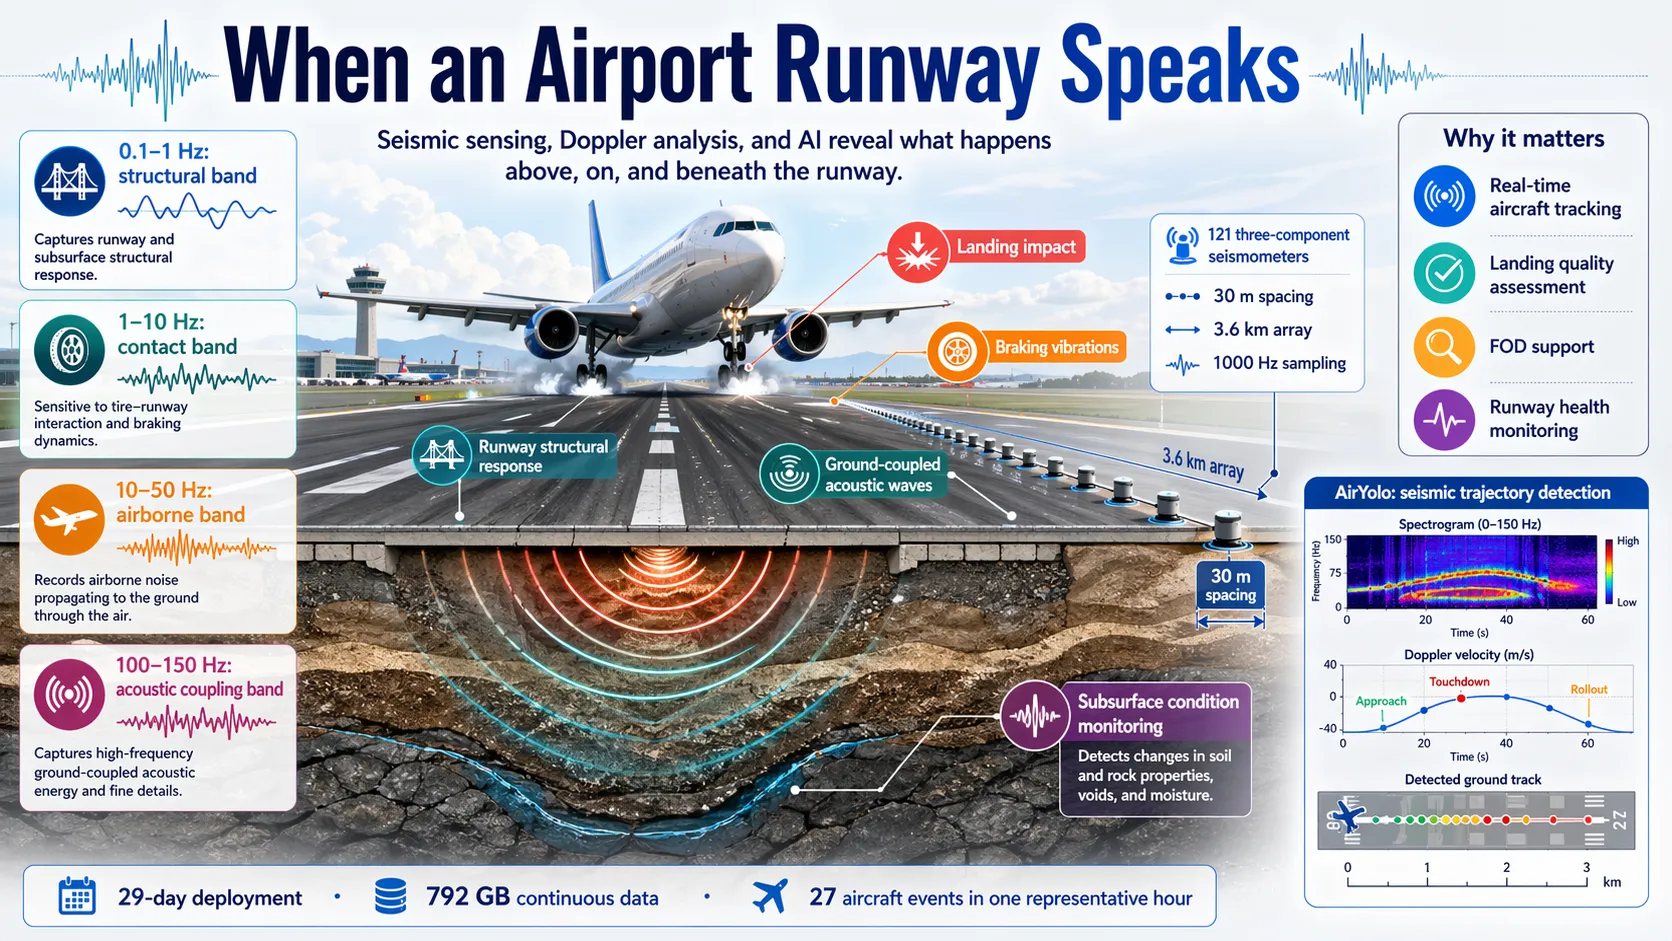
The monitoring system I worked on deployed 121 three-component node seismometers along a runway at a major hub airport. The sensors were placed at 30-meter intervals along the full length of the runway — 3.6 kilometers — with each unit positioned approximately 30 meters from the runway centerline. Sampling rate: 1000 Hz, capturing ground motion at a temporal resolution fine enough to resolve the acoustic coupling phenomena described above.
Three-component means each sensor records simultaneously in three directions: vertical, and two horizontal axes perpendicular to each other. The directional information matters. The pattern of how vibration energy arrives from different angles across the array carries spatial information about the source — where on the runway the event occurred, and what kind of motion generated it.
Data from all 121 sensors was transmitted in real time via 4G networks to a remote processing server. Over a 29-day deployment, the array accumulated 792 gigabytes of continuous seismic records. In one hour of data from a single runway, 27 aircraft landing and takeoff events were identifiable — each leaving a distinct signature that the system could detect, classify, and characterize automatically.
The real-time transmission architecture was built around Kafka — a streaming data pipeline designed for high-throughput, low-latency message handling. The choice was not incidental: a structural health monitoring system that processes data hours after the fact is not a safety system. The entire value proposition depends on detection and response within seconds of an event occurring.
Tracking Aircraft with the Doppler Effect
One of the more elegant capabilities enabled by this sensor configuration is real-time aircraft trajectory reconstruction using the Doppler effect.
The Doppler effect — the change in apparent frequency of a signal as its source moves relative to the observer — is familiar from everyday experience: the pitch of a passing ambulance siren rises as it approaches and falls as it recedes. The same effect applies to the vibrations generated by a moving aircraft. As the aircraft passes a sensor, the frequency of its characteristic ground-coupled signal shifts in a predictable way determined by the aircraft’s velocity, acceleration, and altitude.
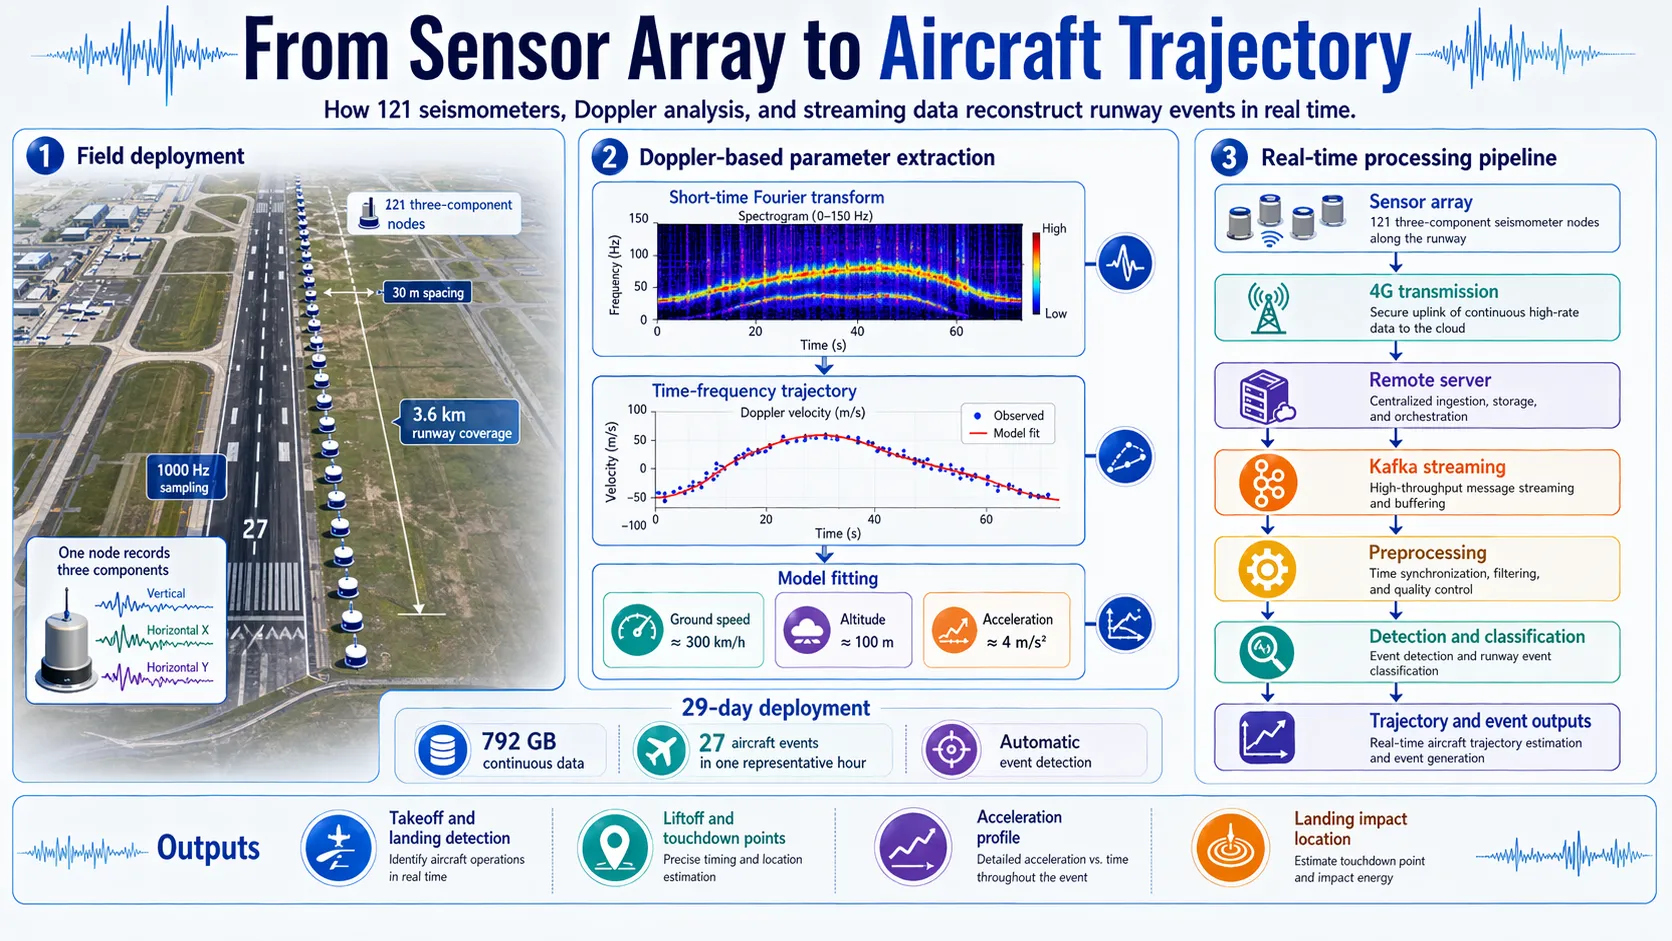
By applying short-time Fourier transforms to the signal from a single sensor and fitting the resulting time-frequency trajectory to a Doppler model, it is possible to extract the aircraft’s instantaneous velocity, acceleration, and height above the sensor at each point during its runway run. In one analyzed takeoff event, this method recovered a ground speed of approximately 300 km/h at the moment of overflight, an altitude of 100 meters, and an acceleration of 4 m/s² — parameters that can be independently cross-checked against flight operations records.
Across the full 121-sensor array, trajectory reconstruction becomes more powerful still. The spatial distribution of the Doppler signatures across sensors provides a complete picture of the aircraft’s path along the runway — not just its speed at one point, but its acceleration profile, its liftoff point, and the precise location and magnitude of the landing impact.
AirYolo: Teaching a Vision Model to See Seismic Signals
Manual analysis of seismic records at the scale of 792 gigabytes is not feasible for operational deployment. The question is how to automate detection and classification reliably enough to support safety-critical decisions.
The approach we developed uses a deep learning architecture called AirYolo — a detection and semantic segmentation model based on the YOLOv8 framework, adapted for seismic time-frequency data. The adaptation is conceptually straightforward: seismic signals are converted to spectrograms — two-dimensional images where the horizontal axis represents time, the vertical axis represents frequency, and brightness indicates signal energy. An aircraft’s trajectory through these spectrograms leaves a characteristic visual pattern: the Doppler curve in the low-frequency band, the contact signatures in the mid-range, the acoustic coupling pattern at high frequencies.
YOLOv8 was originally designed to detect and segment objects in photographs. The insight underlying AirYolo is that detecting aircraft trajectory patterns in spectrograms is structurally the same problem — finding characteristic shapes in two-dimensional images — and the same architectural approach applies.
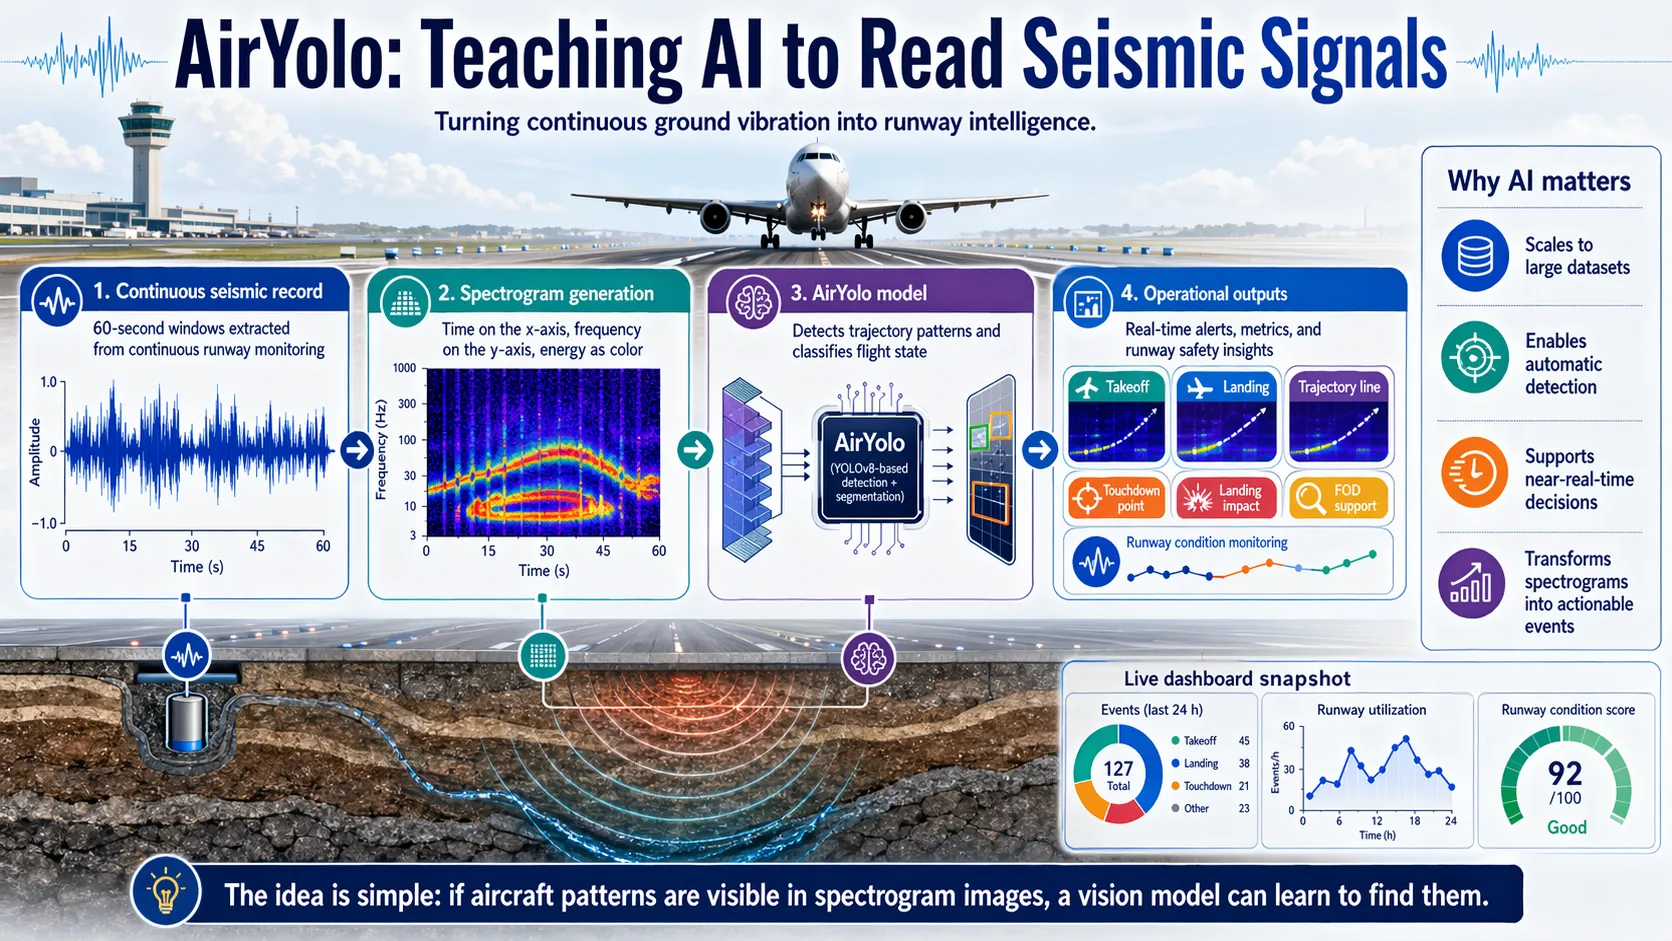
Training data was prepared by segmenting the continuous seismic record into 60-second windows, converting each window to a spectrogram image, and labeling each image with the aircraft events it contained and their classification (takeoff or landing). The trained model was then deployed on the streaming data pipeline to classify incoming windows in real time.
The results from two days of processed data: 1,183 aircraft events detected and classified, covering both takeoffs and landings, with the system correctly distinguishing between the two based on the characteristic differences in their seismic signatures — landings featuring the sharp impulse of main gear touchdown followed by the braking sequence, takeoffs featuring the gradual energy buildup of the acceleration run followed by the abrupt transition to the airborne high-frequency regime.
What the System Was Watching For
Beyond trajectory tracking, the monitoring system addressed several distinct safety-relevant detection tasks.
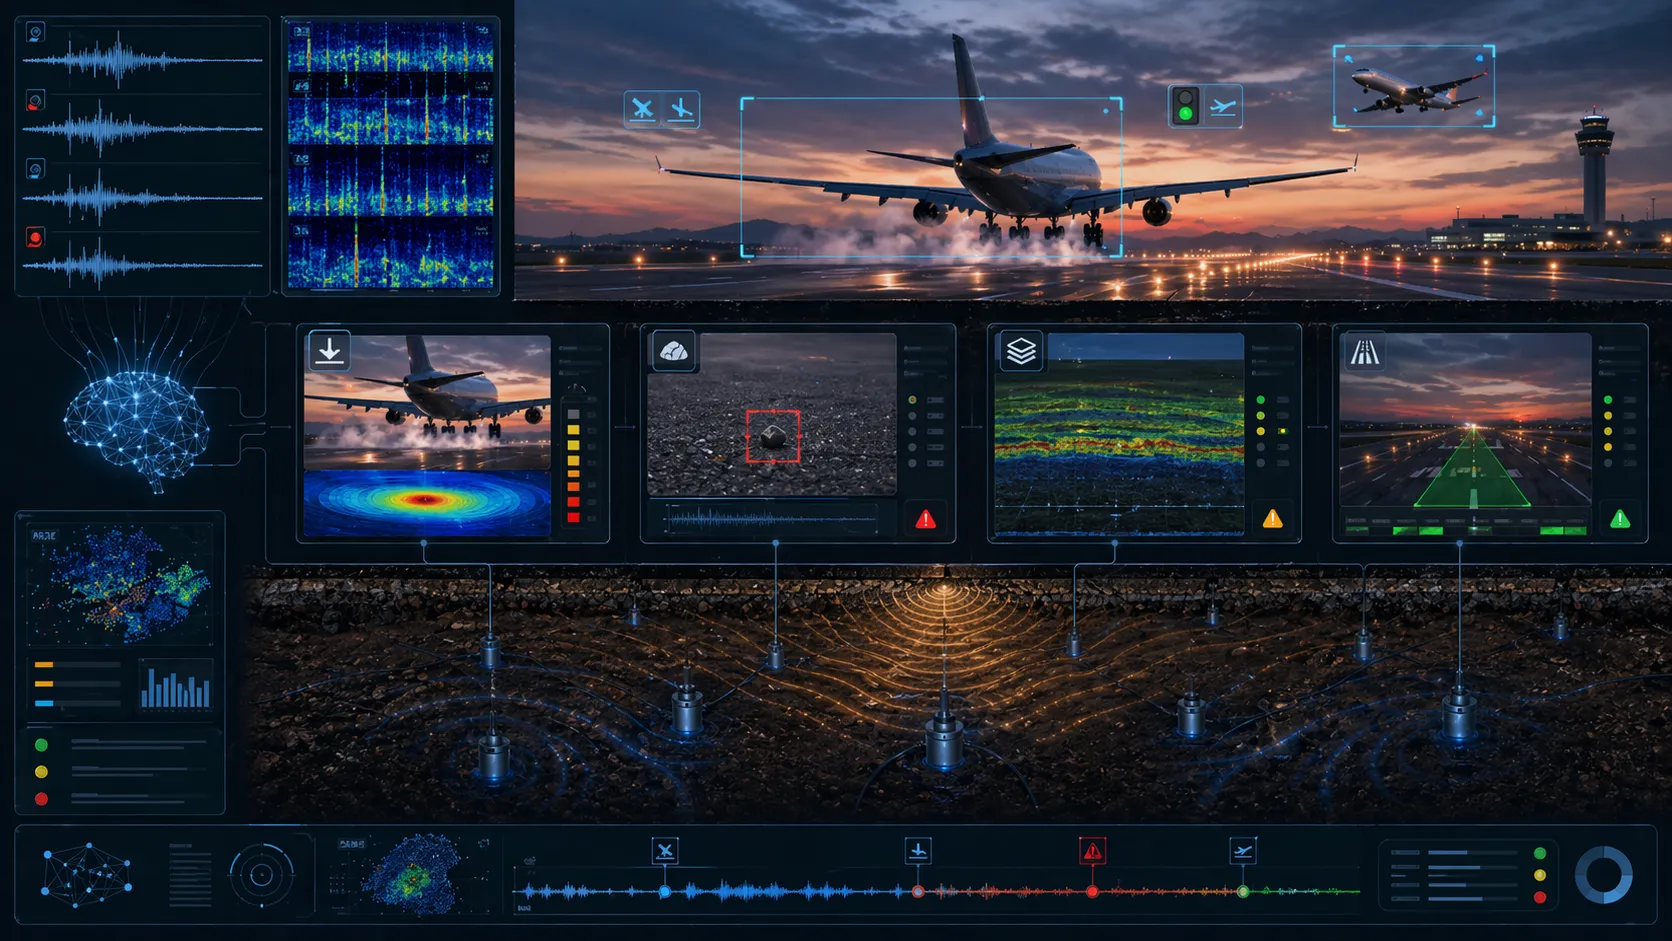
Landing impact quantification. At the touchdown point, the energy spike in the 0.1–1 Hz band allows calculation of the landing impact force — not just “an aircraft landed here” but a quantitative estimate of the mechanical load imposed on the runway structure at that location. Over thousands of landings, this builds a cumulative load record that is directly relevant to pavement fatigue management.
Foreign object debris detection. FOD — foreign object debris — is a persistent hazard. In Chinese airports alone, runway damage incidents from FOD exceed 4,500 cases annually. Camera-based FOD detection systems work well in daylight and good visibility. The seismic system provides a complementary detection channel that is insensitive to lighting and weather: an aircraft running over a foreign object generates a characteristic high-frequency impulse superimposed on the normal landing signature, flagging the event for immediate ground inspection.
Subsurface structural monitoring. The seismic velocity of waves propagating through the runway structure is sensitive to changes in the mechanical properties of the pavement and substrate. Long-term tracking of these velocities — enabled by the continuous nature of the deployment — provides a baseline against which anomalous changes can be detected, potentially flagging developing subsurface problems before they reach the surface.
Simultaneous runway occupancy. In high-traffic conditions, the system continuously monitors how many aircraft are present on the runway at any given time, providing an additional safety check against controller-level conflict detection.
Why Not Just Use More Cameras?
The question is reasonable, and the answer is not “cameras are bad” — it is that cameras and seismic sensors have complementary failure modes, and those failure modes determine what each technology can and cannot reliably protect against.
Cameras see surfaces, in adequate lighting, within their field of view. For detecting a visible object on a runway in daylight, a well-designed camera network performs well. For detecting the structural condition of the pavement two meters below the surface, or quantifying the mechanical load imposed by a landing aircraft on a subslab void that has not yet caused visible damage, cameras have nothing to offer.
The failure modes are also different in a second, important sense: they fail in different conditions. Camera systems degrade in fog, rain, and darkness — conditions that happen to coincide with some of the highest-risk operational scenarios. Seismic systems are insensitive to weather and lighting. They fail differently: they require stable installation, careful calibration, and signal processing pipelines sophisticated enough to handle the complexity of multi-source, multi-frequency ground vibration data.
The most capable airport safety monitoring systems will eventually integrate both modalities — and likely others, including acoustic arrays and radar — each contributing what it is best positioned to measure, each compensating for the other’s blind spots. The seismic component addresses a class of questions that no other currently deployed technology can answer: what is happening beneath the surface, in real time, continuously, regardless of visibility.
A Note on Current Limitations
Responsible technology development requires honesty about what has not yet been demonstrated.
The results described here — trajectory tracking, FOD detection, impact quantification, subsurface monitoring — were demonstrated in a specific deployment, at a specific airport, over a specific period. Generalizing from a successful deployment to a reliable, broadly applicable technology requires more field validation across diverse airport environments, runway configurations, and traffic conditions than currently exists in the published literature.
The physics is well understood. The signal processing methods are proven. The machine learning models perform well on the data they were trained on. The harder questions — how performance degrades in edge cases, how the system should be calibrated for different pavement types, how uncertain estimates should be communicated to operators — are being worked through now, in ongoing deployments.
The runway is speaking. We are getting steadily better at understanding what it says — and, equally importantly, at knowing when we are not sure.
Miao YU is a geophysicist and researcher specializing in seismic sensing and AI-driven infrastructure monitoring. She led the design and deployment of seismic monitoring systems across multiple infrastructure categories including airport runway environments, and holds multiple patents in infrastructure safety monitoring technology.